SP500 LDN TRADING UPDATE 4/3/26

SP500 LDN TRADING UPDATE 4/3/26
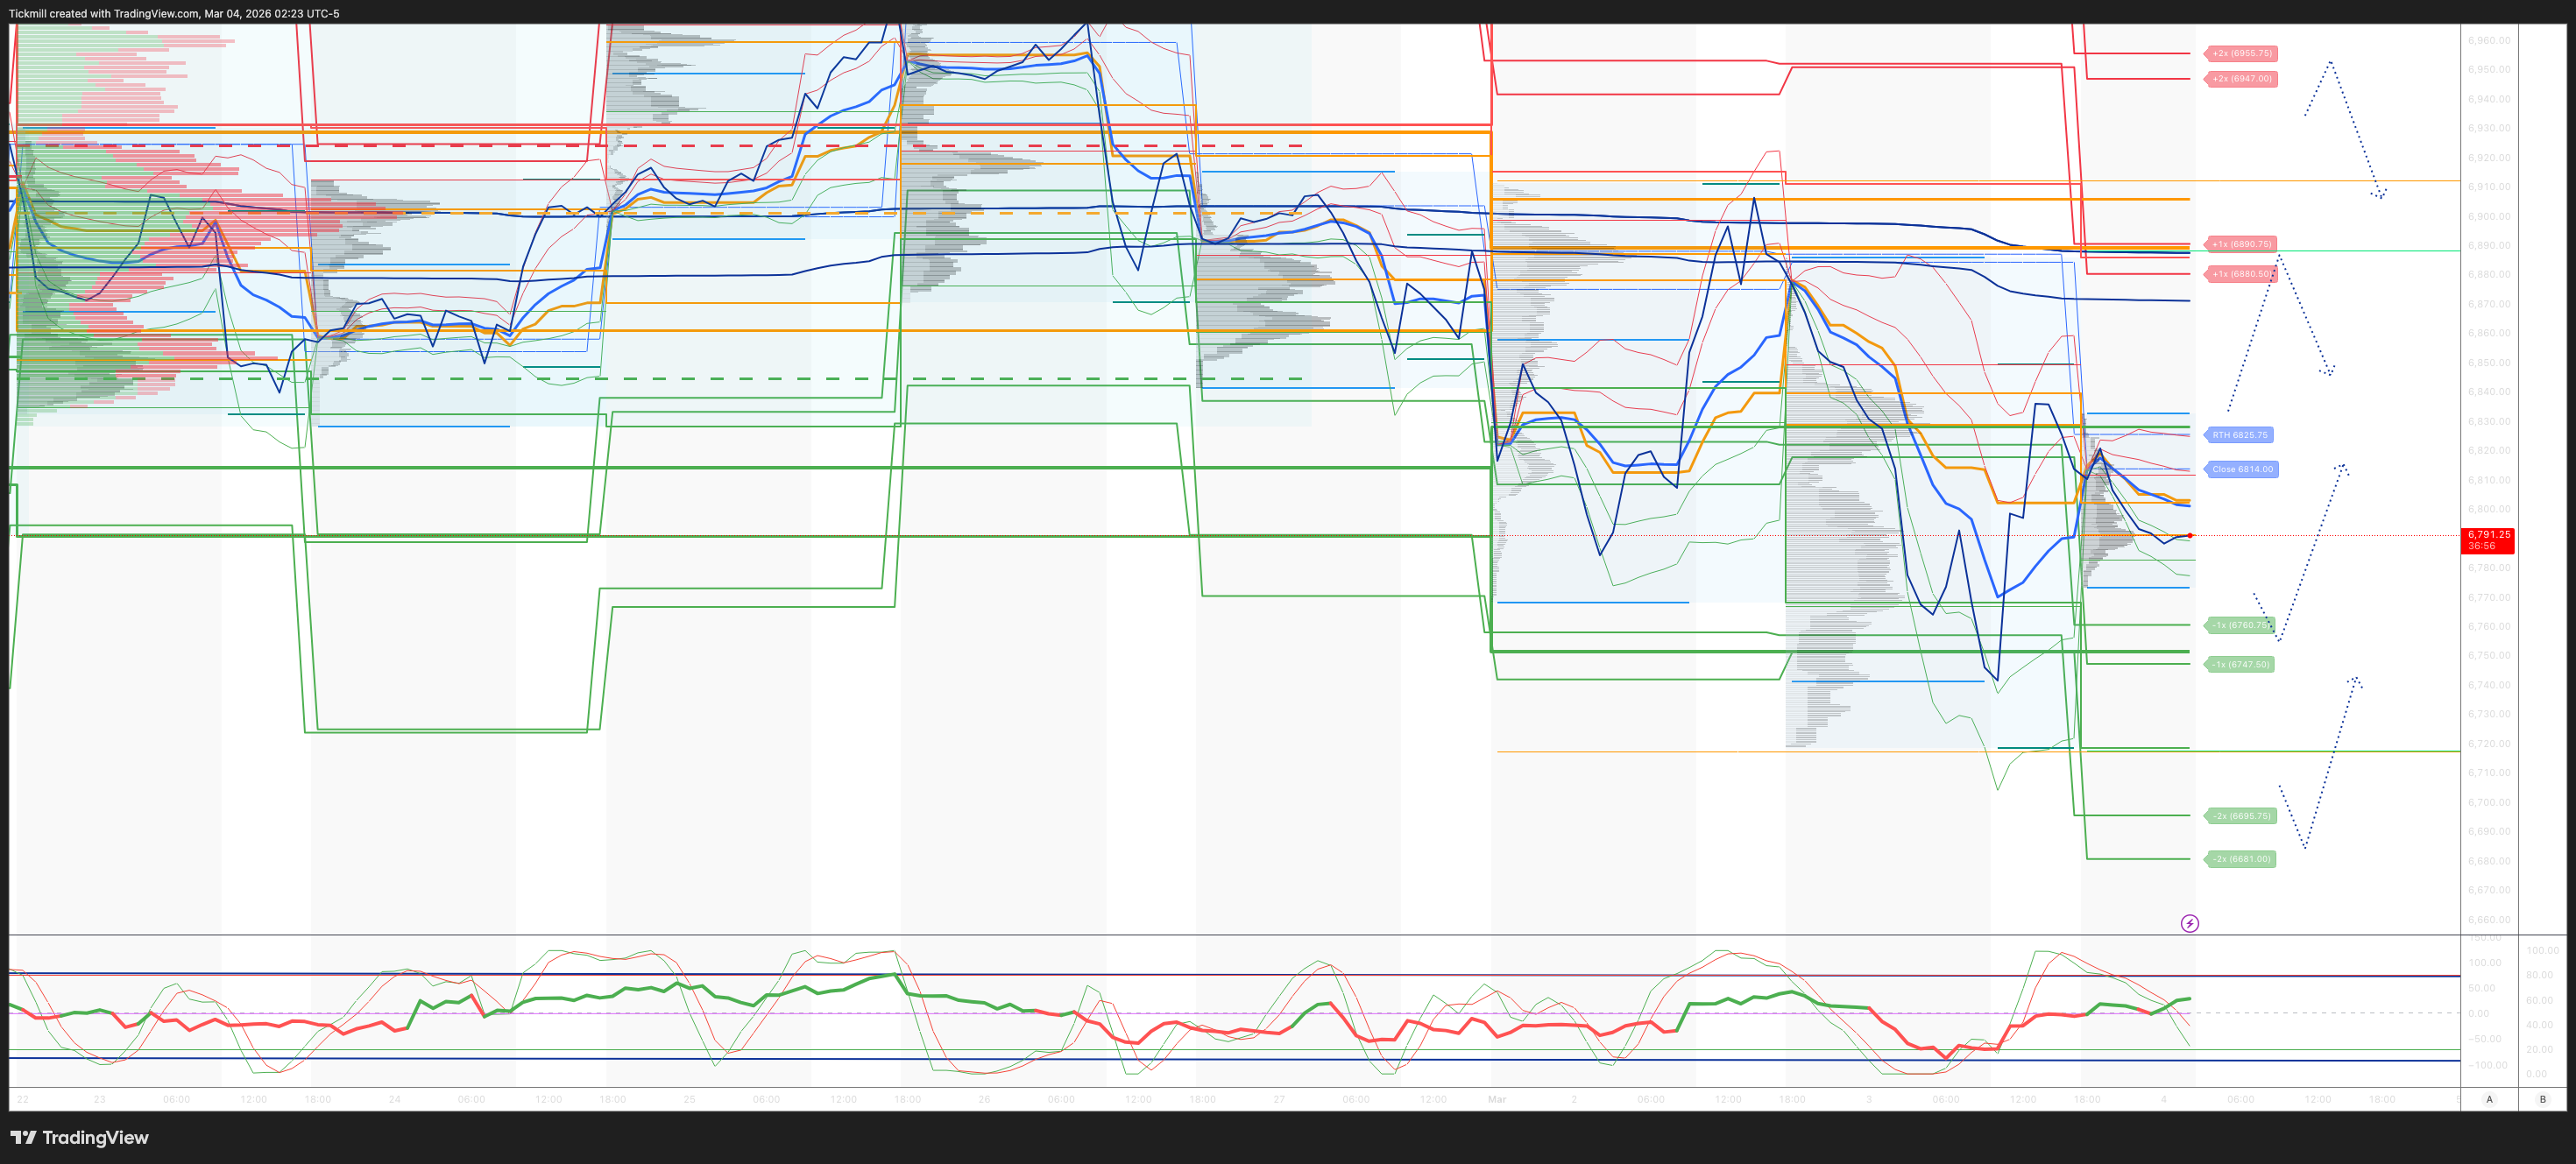
WEEKLY & DAILY LEVELS
***QUOTING ES1! FOR CASH US500 EQUIVALENT LEVELS, SUBTRACT POINT DIFFERENCE***
WEEKLY BULL BEAR ZONE 6940/50
WEEKLY RANGE RES 7031 SUP 6745
Weekly Straddle Range: 143 -point straddle implies a weekly range of [6745, 7031]; monitor 1.5x and 2x moves for key reactions.
March OPEX Straddle: 232.8-point range suggests OPEX-to-OPEX movement between [6677, 7142].
March QOPEX Straddle: 368.55-point range projects [6466, 7203], based on December OPEX.
March EOM Straddle: 255.4-point straddle indicates a monthly range of [6623, 7101]. .
DEC2025 to DEC2026 OPEX straddle spans 945 points, outlining a range of [5889, 7779]."
DAILY VWAP BEARISH 6873
WEEKLY VWAP BEARISH 6917
MONTHLY VWAP BEARISH 6893
DAILY STRUCTURE – OTFD - 6849
WEEKLY STRUCTURE – OTFD
MONTHLY STRUCTURE - OTFD
Balance: This refers to a market condition where prices move within a defined range, reflecting uncertainty as participants await further market-generated information. Our approach to balance includes favouring fade trades at the range extremes (highs/lows) while preparing for potential breakout scenarios if the balance shifts.
One-Time Framing Higher (OTFH): This represents a market trend where each successive bar forms a higher low, signalling a strong and consistent upward movement.
One-Time Framing Lower (OTFD): This describes a market trend where each successive bar forms a lower high, indicating a pronounced and steady downward movement.
DAILY BULL BEAR ZONE 6815/25
GAMMA FLIP 6886
DAILY RANGE RES 6890 SUP 6760
2 SIGMA RES 6955 SUP 6695
VIX BULL BEAR ZONE 20
PUT/CALL RATIO 1.11 (The numbers reflect options traded during the current session. A put-call ratio below 0.7 is generally considered bullish, and a put-call ratio above 1.0 is generally considered bearish)
TRADES & TARGETS
SHORT ON REJECT/RECLAIM OF DAILY BULL BEAR ZONE TARGET DAILY RANGE SUP
LONG ON REJECT/RECLAIM OF DAILY RANGE SUP TARGET DAILY BULL BEAR ZONE
(I FADE TESTS OF 2 SIGMA LEVELS ESPECIALLY INTO THE FINAL HOUR OF THE NY CASH SESSION AS 90% OF THE TIME WHEN TESTED THE MARKET WILL CLOSE ABOVE OR BELOW THESE LEVELS)
GOLDMAN SACHS TRADING DESK VIEW - ‘Nowhere To Hide’
S&P closed down 94bps at 6,817 with a Market-On-Close (MOC) of $180mm to BUY. NDX dropped 109bps to 24,720, R2K fell 179bps to 2,608, and the Dow declined 83bps to 48,501. Trading volume reached 23.93 billion shares across all US equity exchanges, surpassing the YTD daily average of 19.45 billion shares. VIX rose +9.93% to 23.57, WTI Crude surged +4.68% to $74.55, US 10YR increased +3bps to 4.06%, gold dropped -420bps to 5,097, DXY gained +65bps to 99.03, and Bitcoin fell -2.12% to $67,970.
The market showed a "nowhere to hide" sentiment, as anticipated. Momentum Longs were hit hard (GSCBHMOM -5%), following sharp declines in Korea (Kospi -7%, Samsung/Hynix -15%+), which appeared to be the epicenter, impacting momentum assets globally (US Semis -4%, Silver -7%, AI Levered -4%). Equity exposure was systematically reduced across the board, with XOP notably red despite Crude rallying +4%. Liquidity remained impaired, exacerbating price movements, with E-mini top-of-book depth near Liberation Day levels at $3m (compared to $12m YTD average). The CTA medium-term momentum trigger level of 6,750 is nearing activation. Additionally, the market is digesting $15bn of paper issuance ($6bn in the US) from last night.
Activity on the trading floor was subdued, rated at 4 out of 10 in terms of overall levels. The floor ended down 95bps versus a 30-day average of -21bps. As expected, trading was primarily macro and top-down driven, with ETFs accounting for 45% of the tape—the highest level in over five years. Single stock activity was minimal, with mutual funds remaining inactive and hedge funds focusing on marginal adjustments to short books. Late in the day, there were signs of software demand stabilizing, driven by both hedge funds and long-only investors. Conversations acknowledged a potential "buyers live higher" dynamic. Key focus areas this week include tech earnings (CRWD & AVGO), ongoing conferences, and Friday’s NFP and Retail Sales data. Post-bell, CRWD fell -4% AHs after initially rising +5%, despite beating expectations and issuing strong guidance (thanks to Bartlett & Callahan).
Risks to Monitor:
1) Asia has been a major contributor to long/short performance over the past year. Heading into March, Asia Gross/Net allocations are at record highs. A prolonged drawdown in Asia poses significant risks to hedge fund performance.
2) Long exposure in Semiconductor and Semiconductor Equipment stocks globally is at record high levels, while short exposure in Software and IT Services stocks globally is also at record highs.
3) Momentum factor exposure in the global Prime book remains near record highs (99th percentile for 1-year, 100th percentile for 5-year). Medium-term momentum has been the largest positive contributor to global Fundamental L/S alpha returns YTD. However, a sustained momentum reversal could introduce significant performance challenges..
Disclaimer: The material provided is for information purposes only and should not be considered as investment advice. The views, information, or opinions expressed in the text belong solely to the author, and not to the author’s employer, organization, committee or other group or individual or company.
Past performance is not indicative of future results.
High Risk Warning: CFDs are complex instruments and come with a high risk of losing money rapidly due to leverage. 71% and 74% of retail investor accounts lose money when trading CFDs with Tickmill UK Ltd and Tickmill Europe Ltd respectively. You should consider whether you understand how CFDs work and whether you can afford to take the high risk of losing your money.
Futures and Options: Trading futures and options on margin carries a high degree of risk and may result in losses exceeding your initial investment. These products are not suitable for all investors. Ensure you fully understand the risks and take appropriate care to manage your risk.
Patrick has been involved in the financial markets for well over a decade as a self-educated professional trader and money manager. Flitting between the roles of market commentator, analyst and mentor, Patrick has improved the technical skills and psychological stance of literally hundreds of traders – coaching them to become savvy market operators!